Indexing, Slicing and Subsetting DataFrames in Python
Overview
Teaching: 30 min
Exercises: 30 minQuestions
How can I access specific data within my data set?
How can Python and Pandas help me to analyse my data?
Objectives
Describe what 0-based indexing is.
Manipulate and extract data using column headings and index locations.
Employ slicing to select sets of data from a DataFrame.
Employ label and integer-based indexing to select ranges of data in a dataframe.
Reassign values within subsets of a DataFrame.
Create a copy of a DataFrame.
Query / select a subset of data using a set of criteria using the following operators:
==,!=,>,<,>=,<=.Locate subsets of data using masks.
Describe
boolobjects in Python and manipulate data usingbools.
In the first episode of this lesson, we read a CSV file into a pandas’ DataFrame. We learned how to:
- save a DataFrame to a named object,
- perform basic math on data,
- calculate summary statistics, and
- create plots based on the data we loaded into pandas.
In this lesson, we will explore ways to access different parts of the data using:
- indexing,
- slicing, and
- subsetting.
Loading our data
We will continue to use the waves dataset that we worked with in the last episode. If you need to, reopen and read in the data again:
# Make sure pandas is loaded
import pandas as pd

# Read in the wave CSV
waves_df = pd.read_csv("data/waves.csv")
Indexing and Slicing in Python
We often want to work with subsets of a DataFrame object. There are different ways to accomplish this including: using labels (column headings), numeric ranges, or specific x,y index locations.
Selecting data using Labels (Column Headings)
We use square brackets [] to select a subset of a Python object - this is the
same whether it’s a list, a NumPy ndarray, or a Pandas DataFrame. For example,
we can select all data from a column named buoy_id from the waves_df
DataFrame by name. There are two ways to do this:
# TIP: use the .head() method we saw earlier to make output shorter
# Method 1: select a 'subset' of the data using the column name
waves_df['buoy_id']

# Method 2: with Pandas, we can also use the column name as an 'attribute' if
# it's a single word, and this gives the same output
waves_df.buoy_id

# These also give the same output:
waves_df['buoy_id'].head()
waves_df.buoy_id.head()
We can also create a new object that contains only the data within the
buoy_id column as follows:
# Creates an object, waves_buoy, that only contains the `buoy_id` column
waves_buoy = waves_df['buoy_id']
We can pass a list of column names too, as an index to select columns in that order. This is useful when we need to reorganize our data.
NOTE: If a column name is not contained in the DataFrame, an exception (error) will be raised.
# Select the buoy and plot columns from the DataFrame
waves_df[['buoy_id', 'record_id']]

# What happens when you flip the order?
waves_df[['record_id', 'buoy_id']]

# What happens if you ask for a column that doesn't exist?
waves_df['Bbuoys']
Python tells us what type of error it is in the traceback, at the bottom it says
KeyError: 'Bbuoys' which means that Bbuoys is not a valid column name (nor a valid key in
the related Python data type dictionary).
Reminder
The Python language and its modules (such as Pandas) define reserved words that should not be used as identifiers when assigning objects and variable names. Examples of reserved words in Python include the
boolvaluesTrueandFalse, operatorsand,or, andnot, among others. The full list of reserved words for Python version 3 is provided at https://docs.python.org/3/reference/lexical_analysis.html#identifiers.When naming objects and variables, it’s also important to avoid using the names of built-in data structures and methods. For example, a list is a built-in data type. It is possible to use the word ‘list’ as an identifier for a new object, for example
list = ['apples', 'oranges', 'bananas']. However, you would then be unable to create an empty list usinglist()or convert a tuple to a list usinglist(sometuple).
Extracting Range based Subsets: Slicing
Reminder
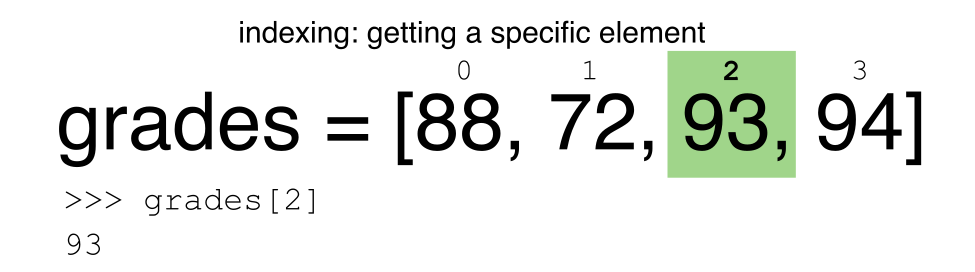
Python uses 0-based indexing.
Let’s remind ourselves that Python uses 0-based
indexing. This means that the first element in an object is located at position
0. This is different from other tools like R and Matlab that index elements
within objects starting at 1.
# Create a list of numbers:
a = [1, 2, 3, 4, 5]
Challenge - Extracting data
What value does the code below return?
a[0]How about this:
a[5]In the example above, calling
a[5]returns an error. Why is that?What about?
a[len(a)]Solution
a[0]` returns 1, as Python starts with element 0 (this may be different from what you have previously experience with other languages e.g. MATLAB and R)a[5]raises an IndexError- The error is raised because the list a has no element with index 5: it has only five entries, indexed from 0 to 4.
a[len(a)]also raises an IndexError.len(a)returns 5, makinga[len(a)]equivalent toa[5]. To retreive the final element of a list, use the index -1, e.g.a[-1]5
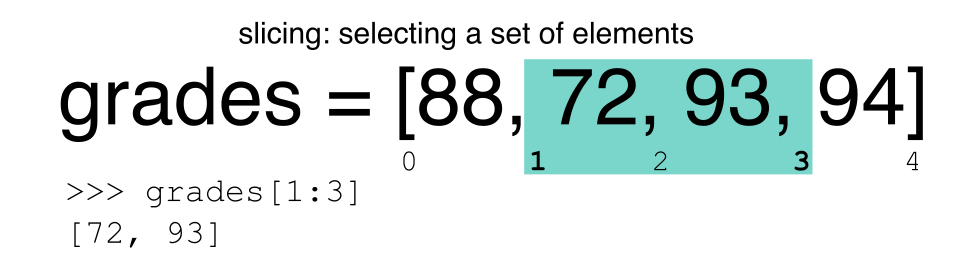
Slicing Subsets of Rows in Python
Slicing using the [] operator selects a set of rows and/or columns from a
DataFrame. To slice out a set of rows, you use the following syntax:
data[start:stop]. When slicing in pandas the start bound is included in the
output. The stop bound is one step BEYOND the row you want to select. So if you
want to select rows 0, 1 and 2 your code would look like this:
# Select rows 0, 1, 2 (row 3 is not selected)
waves_df[0:3]
The stop bound in Python is different from what you might be used to in languages like Matlab and R.
# Select the first 5 rows (rows 0, 1, 2, 3, 4)
waves_df[:5]

# Select the last element in the list
# (the slice starts at the last element, and ends at the end of the list)
waves_df[-1:]
Pandas also recognises the step parameter:
# return every other row in the first ten rows
waves_df[0:10:2]
We can also reassign values within subsets of our DataFrame.
But before we do that, let’s look at the difference between the concept of copying objects and the concept of referencing objects in Python.
Copying Objects vs Referencing Objects in Python
Let’s start with an example:
# Using the 'copy() method'
true_copy_waves_df = waves_df.copy()

# Using the '=' operator
ref_waves_df = waves_df
You might think that the code ref_waves_df = waves_df creates a fresh
distinct copy of the waves_df DataFrame object. However, using the =
operator in the simple statement y = x does not create a copy of our
DataFrame. Instead, y = x creates a new variable y that references the
same object that x refers to. To state this another way, there is only
one object (the DataFrame), and both x and y refer to it.
In contrast, the copy() method for a DataFrame creates a true copy of the
DataFrame.
Let’s look at what happens when we reassign the values within a subset of the DataFrame that references another DataFrame object:
# Assign the value `0` to the first three rows of data in the DataFrame
ref_waves_df[0:3] = 0
Let’s try the following code:
# ref_waves_df was created using the '=' operator
ref_waves_df.head()

# true_copy_waves_df was created using the copy() function
true_copy_waves_df.head()

# waves_df is the original dataframe
waves_df.head()
What is the difference between these three dataframes?
When we assigned the first 3 rows the value of 0 using the
ref_waves_df DataFrame, the waves_df DataFrame is modified too.
Remember we created the reference ref_waves_df object above when we did
ref_waves_df = waves_df. Remember waves_df and ref_waves_df
refer to the same exact DataFrame object. If either one changes the object,
the other will see the same changes to the reference object.
However - true_copy_waves_df was created via the copy() function.
It retains the original values for the first three rows.
To review and recap:
-
Copy uses the dataframe’s
copy()methodtrue_copy_waves_df = waves_df.copy() -
A Reference is created using the
=operatorref_waves_df = waves_df
Inserting columns
You can insert a column of data by specifying a column name that doesn’t already exist and passing a list of the same length as the number of rows; e.g.
waves_df["new_column"] = range(0,2073)
Okay, that’s enough of that. Let’s create a brand new clean dataframe from the original data CSV file.
waves_df = pd.read_csv("data/waves.csv")
Slicing Subsets of Rows and Columns in Python
We can select specific ranges of our data in both the row and column directions using either label or integer-based indexing.
locis primarily label based indexing. Integers may be used but they are interpreted as a label.ilocis primarily integer based indexing
Our dataset has labels for columns, but indexes for rows.
To select a subset of rows and columns from our DataFrame, we can use the
iloc method. For example, for the first 3 rows, we can select record_id, name, and date (columns 0, 2,
and 3 when we start counting at 0), like this:
# iloc[row slicing, column slicing]
waves_df.iloc[0:3, [0,2,3]]
which gives the output
  record_id                             Name                Date
0         1  SW Isles of Scilly WaveNet Site    17/04/2023 00:00
1         2         Hayling Island Waverider    17/04/2023 00:00
2         3      Firth of Forth WaveNet Site    17/04/2023 00:00
Notice that we asked for a slice from 0:3. This yielded 3 rows of data. When you ask for 0:3, you are actually telling Python to start at index 0 and select rows 0, 1, 2 up to but not including 3.
Let’s explore some other ways to index and select subsets of data:
# Select all columns for rows of index values 0 and 10
waves_df.loc[[0, 10], :]

# What does this do?
waves_df.loc[0, ['buoy_id', 'record_id', 'Wave Height']]

# What happens when you type the code below?
waves_df.loc[[0, 10, 35549], :]
NOTE 1: with our dataset, we are using integers even when using loc because our DataFrame index
(which is the unnamed first column) is composed of integers - but Pandas converts these to strings. If you had a column of
strings that you wanted to index using labels, you need to convert that columun using the set_index function
NOTE 2: Labels must be found in the DataFrame or you will get a KeyError.
Indexing by labels loc differs from indexing by integers iloc.
With loc, both the start bound and the stop bound are inclusive. When using
loc, integers can be used, but the integers refer to the
index label and not the position. For example, using loc and select 1:4
will get a different result than using iloc to select rows 1:4.
We can also select a specific data value using a row and
column location within the DataFrame and iloc indexing:
# Syntax for iloc indexing to finding a specific data element
dat.iloc[row, column]
In this iloc example,
waves_df.iloc[2, 6]
gives the output
4.5
Remember that Python indexing begins at 0. So, the index location [2, 6] selects the element that is 3 rows down and 7 columns over (Tpeak) in the DataFrame.
It is worth noting that:
- using
locwith a single list of labels (if the rows are labelled) returns rows - using
ilocwith a single list of integers also returns rows
but
- indexing a data frame directly with labels will select columns (e.g.
waves_df[['buoy_id', 'Name', 'Temperature']]), while ranges of integers will select rows (e.g. waves_df[0:13])
Passing a single integer when trying to index a dataframe will raise an error.
Similarly, direct indexing of rows is redundant with using loc, and will raise a KeyError if a single integer or list is used:
# produces an error - even though you might think it looks sensible
waves_df.loc[1:10,1]

# instead, use this:
waves_df.loc[1:10, "buoy_id"]

# or
waves_df.iloc[1:10, 1]
the error will also occur if index labels are used without loc (or column labels used
with it).
A useful rule of thumb is the following:
- integer-based slicing of rows is best done with
ilocand will avoid errors - it is generally consistent with indexing of Numpy arrays) - label-based slicing of rows is done with
loc - slicing of columns by directly indexing column names.
Challenge - Range
What happens when you execute:
waves_df[0:3]waves_df[0]waves_df[:4]waves_df[:-1]What happens when you call:
waves_df.iloc[0:3]waves_df.iloc[0]waves_df.iloc[:4, :]waves_df.iloc[0:4, 1:4]waves_df.loc[0:4, 1:4]
- How are the last two commands different?
Solution
1.
waves_df[0:3]returns the first three rows of the DataFrame:record_id buoy_id Name Date Tz ... Temperature Spread Operations Seastate Quadrant 0 1 14 SW Isles of Scilly WaveNet Site 17/04/2023 00:00 7.2 ... 10.8 26.0 crew swell west 1 2 7 Hayling Island Waverider 17/04/2023 00:00 4.0 ... 10.2 14.0 crew swell south 2 3 5 Firth of Forth WaveNet Site 17/04/2023 00:00 3.7 ... 7.8 28.0 crew windsea east [3 rows x 13 columns]
waves_df[0]results in a ‘KeyError’, since direct indexing of a row is redundant this way -ilocshould be used instead (waves_df[0:1]could be used to obtain only the first row using this notation)
waves_df[:4]slices from the first row to the fourth:record_id buoy_id Name Date Tz ... Temperature Spread Operations Seastate Quadrant 0 1 14 SW Isles of Scilly WaveNet Site 17/04/2023 00:00 7.2 ... 10.8 26.0 crew swell west 1 2 7 Hayling Island Waverider 17/04/2023 00:00 4.0 ... 10.2 14.0 crew swell south 2 3 5 Firth of Forth WaveNet Site 17/04/2023 00:00 3.7 ... 7.8 28.0 crew windsea east 3 4 3 Chesil Waverider 17/04/2023 00:00 5.5 ... 10.2 48.0 crew swell south
waves_df[:-1]provides everything except the final row of a DataFrame. You can use negative index numbers to count backwards from the last entry.2.
waves_df.iloc[0:1]returns the first rowwaves_df.iloc[0]returns the first row as a named listwaves_df.iloc[:4, :]returns all columns of the first four rowswaves_df.iloc[0:4, 1:4]selects specified columns of the first four rowswaves_df.loc[0:4, 1:4]results in a ‘TypeError’ - see below.While
ilocuses integers as indices and slices accordingly,locworks with labels. It is like accessing values from a dictionary, asking for the key names. Column names 1:4 do not exist, so the call tolocabove results in an error. Check also the difference betweenwaves_df.loc[0:4]andwaves_df.iloc[0:4].
Subsetting Data using Criteria
We can also select a subset of our data using criteria. For example, we can select all rows that have a temperature less than or equal to 10 degrees
waves_df[waves_df.Temperature <= 10]
Which produces the following output:
    record_id    buoy_id                Name                Date     Tz    Peak Direction    Tpeak    Wave Height    Temperature    Spread    Operations    Seastate    Quadrant
3           4	         3    Chesil Waverider    17/04/2023 00:00    5.5             225.0      8.3           0.50          10.20      48.0          crew       swell       south
10         11          3    Chesil Waverider    15/04/2023 00:00    3.2             260.0      3.4           0.21           8.95      67.0          crew     windsea        west
Or, we can select all rows that have a buoy_id of 3:
waves_df[waves_df.buoy_id == 3]
We can also select all rows that do not contain values for Tpeak (listed as NaN):
waves_df[waves_df["Tpeak"].isna()]
Or we can select all rows that do not contain the buoy_id 3:
waves_df[waves_df.buoy_id != 3]
We can define sets of criteria too, for example selecting only waves with a height between 3.0 and 4.0 metres:
waves_df[(waves_df["Wave Height"] >= 3.0) & (waves_df["Wave Height"] < 4.0)]
Different types of and
In Python, we can normally use the keyword
andfor the boolean and operator:x = True y = True x and yTruex = True y = False x and yFalseBut, in Pandas we need to use the
&symbol instead. Theandoperator requires boolean values on both sides, but the boolean value of aSeriesis considered ambiguous, and trying to useandreturns an error.
Python Syntax Cheat Sheet
We can use the syntax below when querying data by criteria from a DataFrame. Experiment with selecting various subsets of the “waves” data.
- Equals:
== - Not equals:
!= - Greater than, less than:
>or< - Greater than or equal to
>= - Less than or equal to
<=
Challenge - Queries
Select a subset of rows in the
waves_dfDataFrame that contain data from the year 2023 and that contain Temperature values less than or equal to 8. How many rows did you end up with? Tip #1: You can’t access attributes of a DateTime objects stored in a Series directly! Tip #2: you may want to create a new column containing the dates formatted as DateType that we created earlier!You can use the
isincommand in Python to query a DataFrame based upon a list of values as follows:waves_df[waves_df['buoy_id'].isin([listGoesHere])]Use the
isinfunction to find all plots that contain buoy ids 5 and 7 in the “waves” DataFrame. How many records contain these values?
Experiment with other queries. e.g. Create a query that finds all rows with a Tpeak greater than or equal to 10.
The
~symbol in Python can be used to return the OPPOSITE of the selection that you specify in Python. It is equivalent to is not in. Write a query that selects all rows with Quadrant NOT equal to ‘south’ or ‘east’ in the “waves” data.Solution
This is possible in one-line:
waves_df[(pd.to_datetime(waves_df.Date, format="%d/%m/%Y %H:%M").dt.year == 2023) & (waves_df["Temperature"] <= 8)]First, we convert the
Datecolumn to objects of typeTimestamp, then use thedtaccessor object to get information about the dates. Aseriesisn’t aTimestamp, so we can’t use theTimestampattributes directly. If we wanted to save just the Year in a new column, we could do:timestamps = pd.to_datetime(waves_df.Date, format="%d/%m/%Y %H:%M") years = timestamps.dt.year waves_df["Year"] = years waves_df[(waves_df.Year == 2023) & (waves_df.Temperature <=8)]And then we can see there are 2 rows which match this condition (don’t forget we can also use the
lenfunction)record_id buoy_id Name Date Tz Peak Direction ... Temperature Spread Operations Seastate Quadrant Year 2 3 5 Firth of Forth WaveNet Site 17/04/2023 00:00 3.7 115.0 ... 7.80 28.0 crew windsea east 2023 9 10 5 Firth of Forth WaveNet Site 15/04/2023 00:00 3.2 124.0 ... 7.35 23.0 crew windsea east 2023 [2 rows x 14 columns]waves_df[waves_df['buoy_id'].isin([5,7])]record_id buoy_id Name Date Tz ... Spread Operations Seastate Quadrant Year 1 2 7 Hayling Island Waverider 17/04/2023 00:00 4.0 ... 14.0 crew swell south 2023 2 3 5 Firth of Forth WaveNet Site 17/04/2023 00:00 3.7 ... 28.0 crew windsea east 2023 8 9 7 Hayling Island Waverider 15/04/2023 00:00 3.7 ... 31.0 crew windsea east 2023 9 10 5 Firth of Forth WaveNet Site 15/04/2023 00:00 3.2 ... 23.0 crew windsea east 2023 1071 1072 5 Firth of Forth WaveNet Site 16/02/2009 11:00 3.0 ... 30.0 crew windsea west 2009 ... ... ... ... ... ... ... ... ... ... ... ... 1350 1351 5 Firth of Forth WaveNet Site 22/02/2009 06:30 2.6 ... 16.0 crew windsea west 2009 1351 1352 5 Firth of Forth WaveNet Site 22/02/2009 07:00 2.7 ... 16.0 crew windsea west 2009 1352 1353 5 Firth of Forth WaveNet Site 22/02/2009 07:30 2.7 ... 16.0 crew windsea west 2009 1353 1354 5 Firth of Forth WaveNet Site 22/02/2009 08:00 2.7 ... 12.0 crew windsea west 2009 1354 1355 5 Firth of Forth WaveNet Site 22/02/2009 08:30 2.8 ... 12.0 crew windsea west 2009 [288 rows x 14 columns]len(waves_df[waves_df['buoy_id'].isin([5,7])])5waves_df[waves_df['Tpeak'] >= 10]waves_df[~waves_df['Quadrant'].isin(['south','east'])]record_id buoy_id Name Date Tz ... Spread Operations Seastate Quadrant Year 0 1 14 SW Isles of Scilly WaveNet Site 17/04/2023 00:00 7.2 ... 26.0 crew swell west 2023 4 5 10 M6 Buoy 17/04/2023 00:00 7.6 ... 89.0 no go swell west 2023 5 6 9 Lomond 17/04/2023 00:00 4.0 ... NaN crew swell north 2023 6 7 2 Cardigan Bay 17/04/2023 00:00 5.9 ... 18.0 crew swell west 2023 7 8 14 SW Isles of Scilly WaveNet Site 15/04/2023 00:00 7.2 ... 18.0 crew swell west 2023 ... ... ... ... ... ... ... ... ... ... ... ... 2068 2069 16 west of Hebrides 18/10/2022 16:00 6.1 ... 28.0 crew swell north 2022 2069 2070 16 west of Hebrides 18/10/2022 16:30 5.9 ... 34.0 crew swell north 2022 2070 2071 16 west of Hebrides 18/10/2022 17:00 5.6 ... 34.0 crew swell north 2022 2071 2072 16 west of Hebrides 18/10/2022 17:30 5.7 ... 31.0 crew swell north 2022 2072 2073 16 west of Hebrides 18/10/2022 18:00 5.7 ... 34.0 crew swell north 2022 [1985 rows x 14 columns]
Using masks to identify a specific condition
A mask can be useful to locate where a particular subset of values exist or
don’t exist - for example, NaN, or “Not a Number” values. To understand masks,
we also need to understand bool objects in Python.
Boolean values are either True or False. For example,
# Set x to 5
x = 5

# What does the code below return?
x > 5

# How about this?
x == 5
When we ask Python whether x is greater than 5, it returns False.
This is Python’s way to say “No”. Indeed, the value of x is 5,
and 5 is not greater than 5.
To create a boolean mask:
- Set the True / False criteria (e.g.
values > 5) - Python will then assess each value in the object to determine whether the value meets the criteria (True) or not (False).
- Python creates an output object that is the same shape as the original
object, but with a
TrueorFalsevalue for each index location.
Let’s try this out. Let’s identify all locations in the wave data that have
null (missing or NaN) data values. We can use the isnull method to do this.
The isnull method will compare each cell with a null value. If an element
has a null value, it will be assigned a value of True in the output object.
pd.isnull(waves_df)
A snippet of the output is below:
    record_id    buoy_id     Name     Date       Tz    Peak Direction    Tpeak    Wave Height    Temperature    Spread    Operations    Seastate    Quadrant
0       False      False    False    False    False             False    False          False          False     False         False       False       False
1       False      False    False    False    False             False    False          False          False     False         False       False       False
2       False      False    False    False    False             False    False          False          False     False         False       False       False
To select the rows where there are null values, we can use the mask as an index to subset our data as follows:
# To select just the rows with NaN values, we can use the 'any()' method
waves_df[pd.isnull(waves_df).any(axis=1)]
Note that the Temperature and other columns of our DataFrame contains many null or NaN
values. Remember we’ve disucssed ways of dealing with this in the previous episode on Data Types and Formats.
As we saw earlier, we can run isnull on a particular column too. What does the code below do?
# What does this do?
waves_df[pd.isnull(waves_df['Temperature'])]['Temperature']
Let’s take a minute to look at the statement above. We are using the bool
array pd.isnull(waves_df['Temperature']) as an index to waves_df. We are
asking Python to select rows that have a NaN value of Temperature.
Challenge - Putting it all together
Create a new DataFrame that only contains observations with Operations values that are not crew or survey. Print the number of rows in this new DataFrame. Verify the result by comparing the number of rows in the new DataFrame with the number of rows in the waves DataFrame where Site Type is No Go.
Create a new DataFrame that contains only observations from the Chesil Waverider or Hayling Island Waverider buoys, and where the wave height is less than 50 cm.
Create a new DataFrame that contains only observations that are of Quadrant north or west and where Tpeak values are greater than 10.
Solution
# 1.
waves_df[
  ~waves_df["Operations"].isin(["crew", "survey"])
]

# 2.
waves_df[
  waves_df.Name.isin(["Chesil Waverider", "Hayling Island Waverider"]) &
  (waves_df['Wave Height'] < 0.5)
]

# 3.
waves_df[
  waves_df.Quadrant.isin(["north", "west"]) &
  (waves_df.Tpeak > 10)
]

# Alternative for 3.
waves_df[(waves_df["buoy_id"].isin([3,7])) & (waves_df["Wave Height"] < 0.5)]
Key Points
In Python, portions of data can be accessed using indices, slices, column headings, and condition-based subsetting.
Python uses 0-based indexing, in which the first element in a list, tuple or any other data structure has an index of 0.
Pandas enables common data exploration steps such as data indexing, slicing and conditional subsetting.